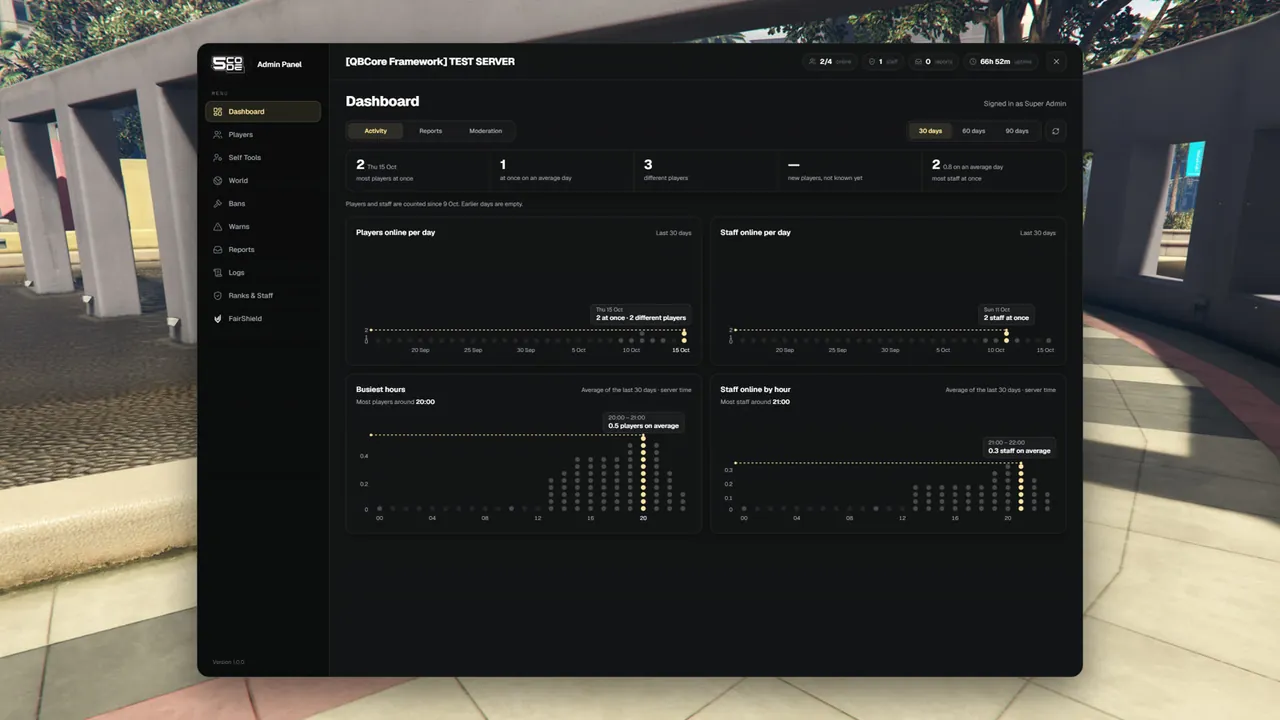
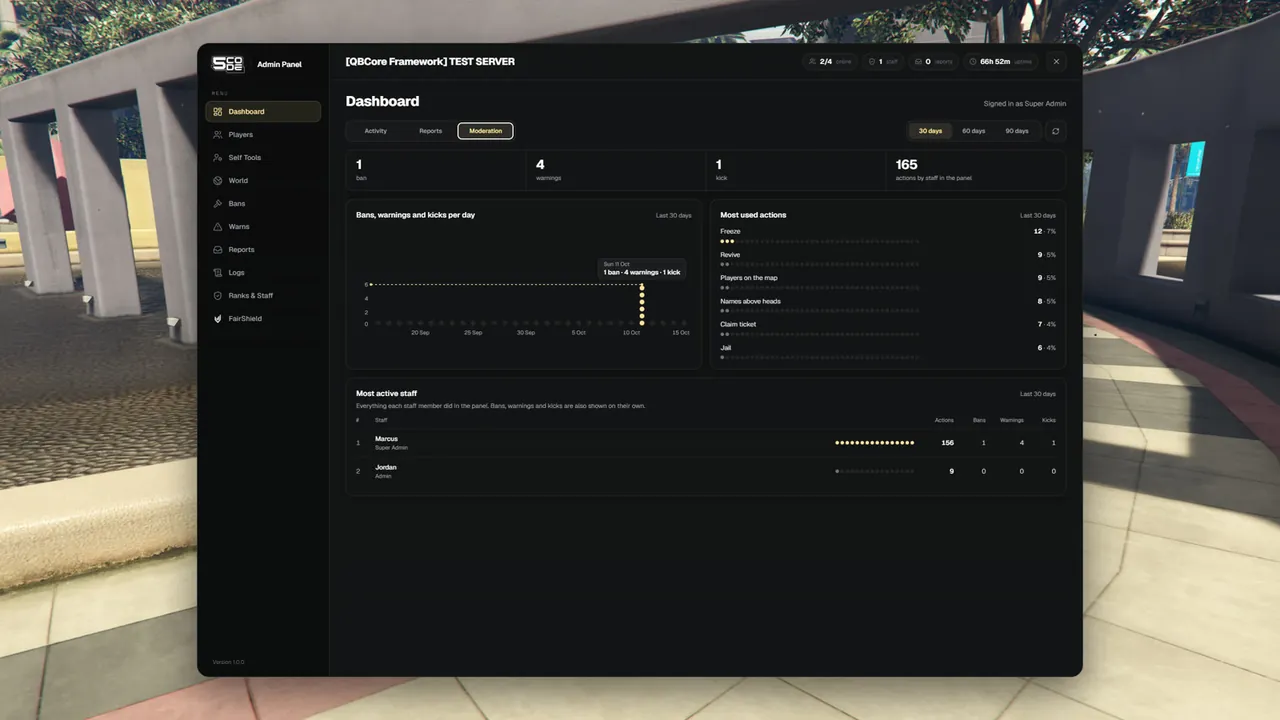
The first page of the panel. It shows how busy your server and your staff team were over the last
30, 60 or 90 days.
# What staff seeThe rank has The page shows
See statistics (stats.view)The statistics: three categories, a range switch and a refresh button Not that permission Three live numbers only: players online now, staff online now, reports not resolved yet
Without the permission the page also says: "Statistics are hidden for your rank. A rank needs
“See statistics”, which is set under Ranks & Staff."
The heading shows your rank: "Signed in as [rank]".
# Using it
Open the panel with /admin. It opens on the Dashboard.
Pick a category: Activity , Reports or Moderation .
Pick a range: 30 days , 60 days or 90 days . Every chart follows it.
Move the mouse over a column of a chart to read its numbers.
Press the round arrow to load the numbers again.
Every chart has 30 columns.
Range One column is
30 days One day 60 days Two days 90 days Three days
# ActivityThe Activity tab: players and staff per day, and the busiest hours. Number What it means
most players at once The highest number of players online at the same moment, and the day it happened at once on an average day The average of the daily highs. Today is left out, and so are days before the counting began different players How many different players were on the server in the range new players Players the panel saw for the first time in the range most staff at once The highest number of staff online at the same moment, with the average per day next to it
Chart What it shows
Players online per day The highest number of players online at the same moment, per day Staff online per day The same for staff Busiest hours The average number of players online in each hour of the day, and the line "Most players around [hour]" Staff online by hour The same for staff, and the line "Most staff around [hour]"
# ReportsNumber What it means
reports opened Tickets players opened in the range resolved How many of them are resolved, with the share in percent average time to claim From the ticket being opened to the first staff member claiming it average time to resolve From the ticket being opened to it being resolved not resolved yet Tickets that are open or claimed right now, whatever their age
Chart What it shows
Reports per day Tickets opened per day. The column also says how many were resolved Reports by day of the week Tickets opened on Mondays, Tuesdays and so on. When the tickets of the range have two or more types, this chart is "Reports by type" instead Staff taking tickets One row per staff member: Claimed , Resolved and Average time to claim
A ticket taken over from another staff member counts as claimed for both.
# ModerationThe Moderation tab: bans, warns, kicks, the most used actions and the most active staff. Number What it means
bans, warnings, kicks How many were given in the range actions by staff in the panel Everything staff did through the panel in the range
Chart What it shows
Bans, warnings and kicks per day The three added up per day. The column gives each number Most used actions The six actions staff used most, with their share Most active staff One row per staff member: Actions , Bans , Warnings and Kicks
The two staff lists show the first 10 rows. Show all opens the rest.
# What is counted, and since whenWhat How it is counted Since
Players and staff online Once a minute The first start of the panel on your server Different players, new players By account. A player with several characters counts once The first start of the panel Tickets From the tickets of the panel The first ticket Bans, warnings, kicks From the log of the panel The first one given through the panel Actions by staff Every line a staff member made in the log The first action
Staff means players with a rank in the panel, and super-admins.Not counted as a staff action: players joining and leaving, a new ticket written by a player,
a banned PC that was refused, and anything done from the server console.When the range starts before the counting did, the page says: "Players and staff are counted
since [date]. Earlier days are empty."
# Numbers that come from the logSome numbers are counted from the log lines. The script deletes log lines older than
Config.LogKeepDays days (default 90).
Read from the log Not read from the log
bans, warnings, kicks: the numbers and the chart per day Players and staff online, different players, new players actions by staff in the panel Reports opened, resolved, not resolved yet Most used actions Average time to claim and to resolve Most active staff Resolved and Average time to claim per staff memberClaimed per staff member in "Staff taking tickets"
Warning:
With the default of 90 days nothing is missing: 90 days is also the longest range. With
Config.LogKeepDays below 90, the numbers in the left column get smaller for the older days,
because those log lines are gone. See General .
# PermissionPermission Key Allows
See statistics stats.viewThe charts and staff lists on the Dashboard
The permission is ticked per rank on Ranks & Staff . See Ranks & Staff .
# Good to know
The top bar has the live numbers on every page: players online, staff online, reports not
resolved yet and the uptime.
Staff with the FairShield lookup permission see a "Connect the FairShield lookup" box here
until an API key is set. See FairShield .
The Dashboard has no config.lua key of its own. Config.LogKeepDays decides how far back the
numbers from the log reach.
# Limits
Days and hours follow the clock of your database server. The hour charts say "server time".
The numbers are worked out at most once a minute. A refresh inside that minute shows the same numbers.
90 days is the longest range.
Only what goes through the panel is counted. A ban or a kick from another tool is not in these numbers.
Kick all on the World page is not counted as a kick. It counts as one staff action.Bans, warnings, kicks and staff actions are read from the log. With Config.LogKeepDays below 90 they get smaller for older days. See Numbers that come from the log .
Staff are shown with the name and rank the panel saw last.
If the numbers cannot be read, the page says "The statistics could not be loaded." with a Try again button.